In the realm of technical analysis, the Chaikin Money Flow (CMF) Indicator stands out as a powerful tool for evaluating market trends and momentum. Developed by Marc Chaikin, this indicator combines price and volume to provide insights into the buying and selling pressure within a market. But how can you unlock the power of the Chaikin Money Flow Indicator? Understanding its components, interpretation methods, and practical applications can enhance your trading strategy and improve decision-making. Let’s explore how to effectively leverage the CMF Indicator to gain a trading edge.
What is the Chaikin Money Flow Indicator?
The Chaikin Money Flow Indicator is designed to assess the flow of money into and out of a security over a specified period. It integrates both price and volume to measure the accumulation or distribution of a stock or market. The CMF Indicator uses a combination of the accumulation line and the distribution line, calculating a cumulative value that reflects the overall buying and selling pressure.
The basic formula involves calculating the Money Flow Multiplier, which measures the position of the closing price relative to the high-low range, and the Money Flow Volume, which multiplies this value by the trading volume. The CMF Indicator then averages these values over a set period, typically 20 or 21 days, to produce a smoothed line that fluctuates above and below zero.
How Can You Unlock the Power of the Chaikin Money Flow Indicator?
Understanding CMF Values
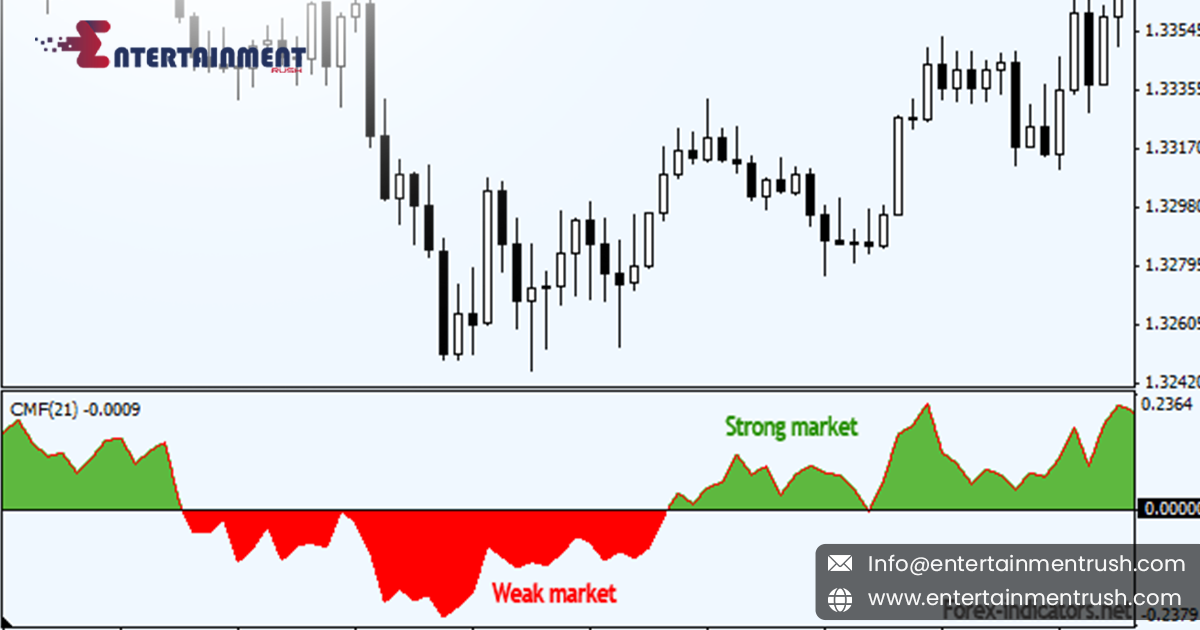
To unlock the power of the Chaikin Money Flow Indicator, start by understanding its values and what they signify. The CMF value oscillates above and below zero, reflecting the overall market sentiment. Positive CMF values suggest that the buying pressure is stronger than the selling pressure, indicating accumulation. Conversely, negative CMF values indicate that selling pressure exceeds buying pressure, signaling distribution.
A rising CMF value suggests increasing buying pressure, while a falling CMF value indicates growing selling pressure. By analyzing these movements, traders can gauge the strength of a trend and make informed decisions about entering or exiting trades.
Identifying Accumulation and Distribution
The CMF Indicator is particularly useful for identifying periods of accumulation and distribution. Accumulation occurs when the CMF value is positive, and the indicator is rising, suggesting that investors are buying and holding a security. This period of accumulation often precedes a price increase, making it a potential signal for buying.
On the other hand, distribution happens when the CMF value is negative and declining, indicating that selling pressure is dominating. This phase typically precedes a price decrease, signaling a potential opportunity for selling or shorting.
By monitoring these phases, traders can identify potential market turning points and adjust their strategies accordingly.
Spotting Divergences
Divergences between the CMF Indicator and price action can be a powerful signal of potential reversals. A bullish divergence occurs when the price makes a lower low, but the CMF Indicator makes a higher low. This indicates that despite the lower prices, buying pressure is increasing, suggesting a potential upward reversal.
Conversely, a bearish divergence happens when the price makes a higher high, but the CMF Indicator makes a lower high. This suggests that buying pressure is weakening despite higher prices, indicating a possible downward reversal.
By spotting these divergences, traders can gain insights into potential shifts in market direction and adjust their trades to capitalize on emerging trends.
Combining CMF with Other Indicators
While the CMF Indicator is a valuable tool, its effectiveness is enhanced when used in conjunction with other technical indicators. Combining the CMF with trend indicators, such as moving averages, or momentum indicators, like the Relative Strength Index (RSI), can provide a more comprehensive view of market conditions.
For instance, if the CMF Indicator is showing positive values while the price is above a moving average, it reinforces the strength of the bullish trend. Conversely, if the CMF Indicator is negative and the price is below a moving average, it strengthens the bearish trend.
By integrating the CMF with other indicators, traders can confirm signals and improve the accuracy of their trading decisions.
Adjusting Timeframes for Specific Strategies
The effectiveness of the CMF Indicator can vary based on the timeframe used. Shorter timeframes, such as daily charts, may provide more frequent signals but can also be subject to noise and false signals. Longer timeframes, like weekly charts, offer a broader perspective and can help filter out short-term fluctuations.
Traders should adjust the timeframe of the CMF Indicator based on their trading strategy and goals. Day traders might use shorter periods to capture quick market movements, while swing traders or long-term investors may prefer longer periods to identify more significant trends.
Practical Application in Trading
To effectively use the Chaikin Money Flow Indicator in trading, apply it to real market scenarios and practice interpreting its signals. Start by analyzing historical data to understand how the CMF Indicator responded to past market conditions and price movements. Test different settings and timeframes to determine what works best for your trading style.
Utilize the CMF Indicator in conjunction with your trading plan, risk management strategies, and other tools to create a well-rounded approach. Regularly review and refine your use of the CMF Indicator to ensure it continues to provide valuable insights as market conditions evolve.
Conclusion
So, how can you unlock the power of the Chaikin Money Flow Indicator? By understanding its values, identifying accumulation and distribution phases, spotting divergences, and combining it with other technical indicators, traders can effectively utilize the CMF Indicator to enhance their trading strategies. Adjusting timeframes and applying the indicator in practical trading scenarios can further refine its effectiveness. As you master the use of the Chaikin Money Flow Indicator, you’ll gain valuable insights into market trends and momentum, ultimately improving your ability to make informed and successful trading decisions.
